Most storage ROI calculators are lead capture forms wearing a spreadsheet costume. They ship with generous default assumptions, produce a payback figure inside four years no matter what you type, and ask for your email before showing it. The number they give you is not wrong so much as it is unfalsifiable, because you never see which assumptions produced it.
In short: payback on commercial thermal energy storage is driven by four things, and only four: your demand charge and time-of-use spread, how much of your load is actually thermal and shiftable, your net installed cost after incentives and depreciation, and whether the storage lets you buy smaller equipment. That last one is the item most ROI models omit entirely, and it is often the largest single term. The calculator runs the math on numbers you supply. It ships with no default savings, it will tell you when a project does not pencil, and it shows a range rather than a single confident figure, because a single confident figure on a twenty-year projection is a marketing artifact.
In this article
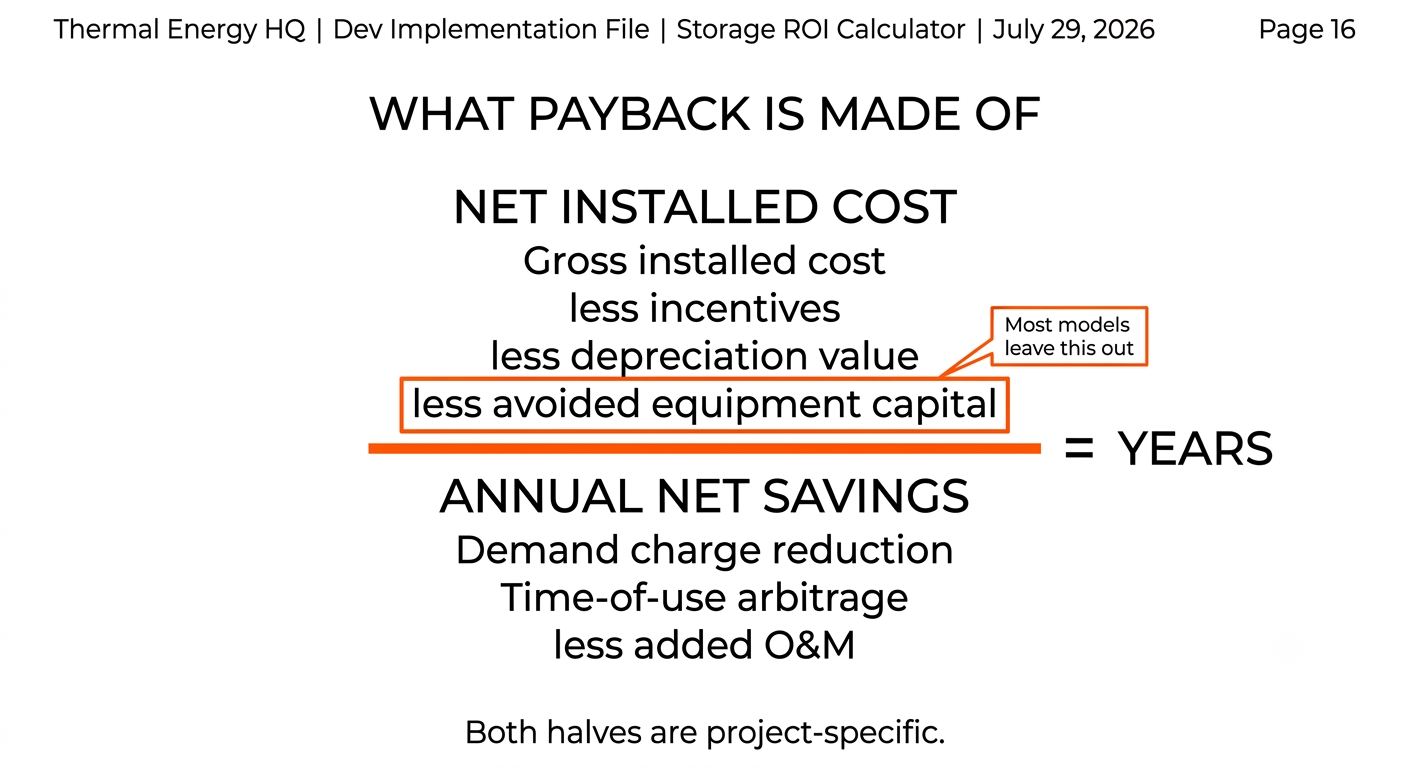
Simple payback is a fraction:
Simple payback (years) = Net installed cost ÷ Annual net savings
Every vendor ROI calculator works on the denominator, because annual savings is where the exciting numbers live. Far fewer work seriously on the numerator, and on a thermal storage project the numerator is where a large share of the value actually sits.
Net installed cost is not the quoted price. It is the quoted price, minus incentives, minus the tax value of depreciation, minus the capital you did not have to spend because storage was in the design. That last term is the one this article exists to argue for.
Annual net savings is the sum of demand charge reduction, time-of-use energy arbitrage, and any efficiency gain, minus any increase in operating or maintenance cost. It is not the gross utility bill and it is not a percentage of it.
The reason to be careful here is that both halves are commonly overstated in vendor material, and the errors compound multiplicatively. Inflate savings by a third, understate net cost by a third, and a nine-year payback presents as five. That is not a rounding difference; it is the difference between a project that clears a capital committee on true information and one that clears on false information and disappoints later.
Storage earns money from the difference between what electricity costs at different times, and from the penalty your utility charges for your highest instantaneous draw. If neither exists on your tariff, storage has nothing to arbitrage and the honest answer is that the project does not pencil on energy savings alone.
Two lines on the bill matter. The demand charge is billed in dollars per kilowatt on your peak draw, typically set by the single highest interval in the billing period, which for many commercial customers is a 15-minute window. The time-of-use energy spread is the gap between peak and off-peak per-kilowatt-hour pricing, which is what a load shift monetizes. The mechanics of both are covered in peak shaving versus load shifting.
Scale matters here, and it is well documented. NREL's survey of more than 10,000 tariffs across 48 states, summarized in the lab's analysis of behind-the-meter storage markets, found roughly 5 million commercial customers on tariffs carrying demand charges at or above $15/kW, an industry benchmark for storage economics, and the lab has reported that demand charges commonly account for 30 to 70 percent of a commercial electric bill. The full survey and a national dataset of demand charge rates are both public. Guidance on reading these lines off an actual bill is in NREL's REopt curriculum.
Tariff details that change the answer materially and are knowable in an afternoon: whether the demand charge is coincident with the utility system peak or based on your own non-coincident peak, whether it is seasonal, whether a ratchet provision carries a high peak forward into later billing periods, and whether you are on an event-based rate. Read the tariff sheet before you model anything.
The second input is the one that separates a real estimate from a hopeful one. Storage can only monetize the load it can actually reach.
The good news is that in most buildings the thermal share is large. EIA found that space heating and water heating together accounted for 62 percent of household energy consumption, and specifically noted that in large apartment buildings water heating energy use often exceeds space heating. Domestic hot water is also unusually cooperative to shift, because occupants care about temperature at the tap rather than when the water was heated. DOE's Grid-interactive Efficient Buildings initiative has funded research on exactly this flexibility potential.
The discipline is to model the reachable load rather than the total load. Ask three questions: what fraction of consumption is thermal, what fraction of that is actually shiftable given the building's schedule and comfort requirements, and how many kilowatts of the peak are set by thermal equipment rather than by motors, chargers, elevators, or IT load. If your critical interval is set by non-thermal equipment, thermal storage will not shave it at any tank size, and no ROI model should pretend otherwise. Sizing the storage itself is covered in the thermal storage tank sizing calculator.
Gross project cost is the least interesting number in the model. What drives payback is what the project costs after the tax code is finished with it. Treat everything in this section as a map rather than tax advice, and confirm your own position with a tax professional; eligibility is project-specific and depends on your structure, tax appetite, and sourcing.
The technology-neutral Clean Electricity Investment Credit under §48E applies to commercial and third-party-owned projects, subject to construction-timing, prevailing wage and apprenticeship, and prohibited foreign entity sourcing rules. The point that matters for thermal projects is statutory rather than interpretive: the definition of energy storage technology in 26 U.S.C. §48E expressly includes thermal energy storage. Thermal projects are not an incentive orphan sitting outside the credit that batteries enjoy.
This is the part most ROI discussions skip, and in 2026 it is worth precision because the rules moved and much of the published commentary has it garbled.
IRS guidance on cost recovery for qualified clean energy facilities, property and technology states that owners of energy storage technology as defined in §48E(c)(2), placed in service after December 31, 2024, may be eligible for 5-year MACRS treatment under §168(e)(3)(B). Separately, IRS Publication 946 records that §70509 of P.L. 119-21 removed solar or wind energy property from the 5-year property definition for property beginning construction after December 31, 2024. Those are two different outcomes, and a number of vendor articles have merged them into a single incorrect claim that storage lost 5-year treatment. It did not. Solar did.
Layered on top, 100 percent bonus depreciation was restored for qualifying property acquired and placed in service after January 19, 2025, which for a taxpayer with sufficient taxable income means the depreciable basis can be recovered far faster than a five-year schedule alone would allow. The combined effect on net installed cost is significant enough that a model ignoring depreciation is not a serious model. Whether a specific thermal storage installation meets the §48E(c)(2) definition, and what basis reduction applies when a credit is claimed, are project-level determinations for your tax advisor.
Utility custom commercial and multifamily efficiency rebates tied to measured energy and demand savings are generally the most reliable path for thermal projects, and they vary by territory. California's Self-Generation Incentive Program is now overwhelmingly a battery program with fast-moving budgets, so verify current status rather than assuming availability. Incentive eligibility is project-specific and requires professional confirmation.
Here is the argument that changes project economics more than any refinement to the savings side, and it is missing from nearly every storage ROI calculator on the internet.
Storage does not only generate annual savings. It reduces the capital cost of the rest of the system, in year zero, before a single kilowatt-hour has been shifted.
A central heat pump plant sized to meet a building's peak morning hot water draw directly must be large, expensive, and heavily cycled. Put storage in the design and the same peak is served by a smaller heat pump running longer during off-peak hours, with stored hot water carrying the draw. You buy less heat pump. On larger projects the effect can extend further: reducing peak electrical demand can avoid or defer an electrical service upgrade, a transformer, or switchgear, which are among the most expensive and schedule-destroying line items in an electrification retrofit. DOE's Better Buildings thermal storage guidance identifies enabling cost-effective electrification as a core function of thermal storage for precisely this reason.
In the payback fraction, this term belongs in the numerator as avoided capital, not in the denominator as annual savings. That placement matters enormously, because a dollar of avoided capital in year zero reduces payback far more efficiently than a dollar of annual savings does. A model that ignores it will systematically understate the case for storage, which is why the calculator exposes it as an explicit input rather than burying it.
The honest constraint on this argument: the avoided capital is only real if the equipment actually gets downsized in the design. If your mechanical engineer sizes the heat pump as though the storage were not there, the saving does not exist and it must not be claimed. This is a design coordination question, and the figure should be entered only after the engineer has confirmed it.
Simple payback is popular because it is easy to explain to a board. It is also the least informative of the common measures, for three reasons: it ignores the time value of money, it ignores everything that happens after the payback date, and it ignores differences in asset life and replacement schedules between the options being compared.
Common financial metrics for storage projects
MetricWhat it tells youWhat it hidesUse it when
Simple paybackHow long until cumulative savings equal net costDiscounting, everything post-payback, replacement events, asset lifeScreening only, or when a capital committee demands one number
Net present value (NPV)Value created over the analysis period in today's dollarsRequires a discount rate you must justify; not scale-freeDeciding whether a project creates value
Internal rate of return (IRR)Return expressed as a rate, comparable to other uses of capitalCan mislead with unconventional cash flows; ignores project scaleComparing against alternative investments
Levelized cost of storage (LCOS)Lifetime cost per kilowatt-hour of storage deliveredSensitive to assumed cycle count and lifetimeComparing storage technologies against each other
Life-cycle cost (LCCA)Total cost of ownership across the analysis periodMore inputs, more assumptions to defendInstitutional and public-sector capital decisions
One asymmetry deserves its own paragraph because it is invisible in a simple payback calculation. A cycle-limited electrochemical system carries at least one capacity-driven replacement event inside a typical twenty-year hold, at a cost that is a substantial fraction of the original installation. A water-filled insulated tank does not: the storage medium does not degrade, so there is no capacity replacement for the storage asset itself. Pumps, valves, controls, and insulation remain serviceable components with finite lives, and water chemistry needs attention, so this is not a claim that a thermal system is maintenance-free. It is a narrower and fully defensible claim about the storage medium. For context on what a stored kilowatt-hour costs in each case, NREL benchmarked a complete 4-hour utility-scale lithium-ion system near $334 per kilowatt-hour in 2024 against modular thermal tanks listing at roughly $54 to $97 per stored kilowatt-hour.

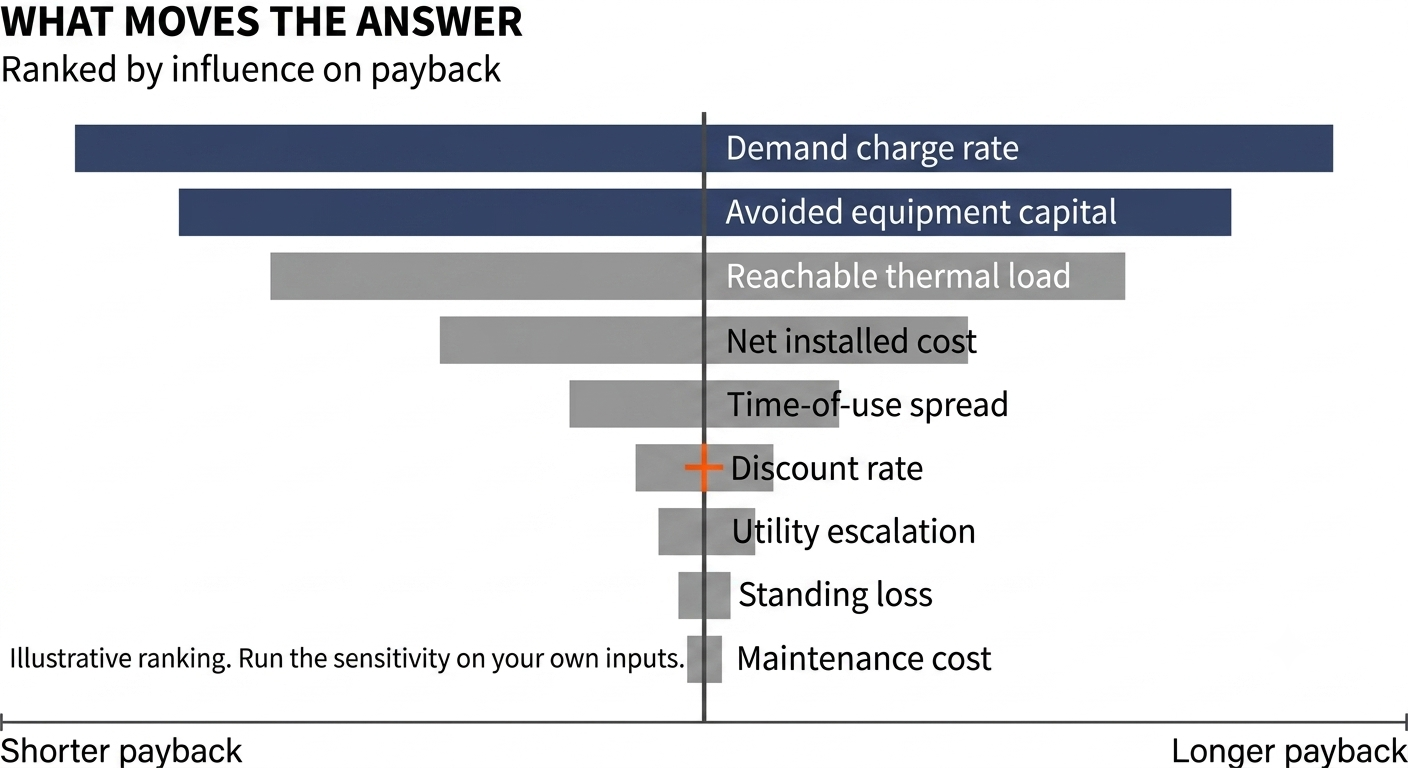
Rather than defend a single payback figure, it is more useful to know which assumptions the figure is standing on. In our experience the ordering below holds across most commercial thermal storage projects, and the sensitivity panel is built to make this visible on your own numbers rather than ours.
Sensitivity drivers for commercial thermal storage payback
AssumptionTypical influence on paybackHow to reduce the uncertainty
Demand charge rate ($/kW) and how the peak is setVery highRead the tariff sheet; confirm coincident versus non-coincident and any ratchet
Avoided equipment capital (smaller heat pump, avoided service upgrade)Very highGet the downsizing confirmed in writing by the mechanical engineer
Reachable thermal load and peak contributionHighTwelve months of interval data; submetering where available
Net installed cost after incentives and depreciationHighFirm quote plus a tax professional's read on credit and depreciation position
Time-of-use spread and its persistenceModerate to highCurrent tariff, plus a view on rate design direction in your territory
Discount rate (NPV and IRR only)ModerateUse your organization's stated cost of capital
Escalation of utility ratesModerate, grows with analysis periodModel a range rather than a point estimate
Standing loss and parasitic pump energyLow to moderatePublished per-model figures; longer hold periods matter more
Maintenance costLowFacilities team's existing cost basis for similar mechanical equipment
A tool that can only return good news is not a tool. Four situations where the honest answer is no, or not yet.
It does not estimate your utility bill or your savings. You supply the rate inputs. If you do not have them, the tool will not guess, because a guess dressed as a projection is worse than no number.
It does not model your draw profile hour by hour. It works from the peak and shiftable-load figures you provide. Hourly dispatch modeling is a design-stage exercise.
It does not give tax advice and its depreciation and credit handling are illustrative arithmetic on inputs your tax professional should confirm.
It does not model rate escalation, degradation of savings, or utility program changes beyond the simple escalation input provided.
It is not an investment-grade financial model and should not be attached to a financing application as one. It is a screening tool that tells you whether a project deserves a real model.
There is no single answer, and any vendor offering one before seeing your tariff and interval data is producing a marketing figure. Payback is net installed cost divided by annual net savings, and both halves are project-specific. What determines it is your demand charge and time-of-use spread, how much of your load is thermal and reachable, your net cost after incentives and depreciation, and whether the storage lets you buy smaller equipment. Projects with a high demand charge and a large central hot water load sit at the favorable end; projects on a flat rate with no demand charge often do not pencil at all.
Start with simple payback: net installed cost divided by annual net savings. Net installed cost is the quoted price minus incentives, minus the tax value of depreciation, minus capital you avoided spending because storage allowed smaller equipment. Annual net savings is demand charge reduction plus time-of-use energy arbitrage plus any efficiency gain, minus added operating cost. For a decision rather than a screen, move to net present value or life-cycle cost, which account for the time value of money and for the full analysis period.
Usually the demand charge rate and how your utility sets your peak, closely followed by avoided equipment capital. Both are capital-side or tariff-side rather than the savings percentages most models focus on. Demand charges are frequently a large share of a commercial electric bill, and NREL's national tariff survey found roughly 5 million commercial customers with tariffs carrying demand charges at or above $15 per kilowatt.
Thermal energy storage is expressly within the statutory definition of energy storage technology under 26 U.S.C. section 48E, the commercial technology-neutral Clean Electricity Investment Credit. Credit value depends on project size, prevailing wage and apprenticeship compliance, and prohibited foreign entity sourcing rules, and whether a specific installation qualifies is a project-level determination. Confirm with a tax professional.
IRS guidance states that energy storage technology as defined in section 48E(c)(2), placed in service after December 31, 2024, may be eligible for 5-year MACRS treatment under section 168(e)(3)(B). Separately, Publication 946 records that section 70509 of P.L. 119-21 removed solar or wind energy property from the 5-year property definition for construction beginning after that date, which is a different provision that some published commentary incorrectly applies to storage. One hundred percent bonus depreciation was also restored for qualifying property acquired and placed in service after January 19, 2025. Your tax professional should confirm how these apply to your project.
Because it ignores the time value of money, everything that happens after the payback date, and differences in asset life between the options being compared. A technology that pays back slightly faster but requires a capacity replacement in year ten can be the worse investment across a twenty-year hold. Net present value, internal rate of return, levelized cost of storage, and life-cycle cost analysis all address at least one of those blind spots.
Not for the storage medium. Water does not degrade with cycling, so there is no capacity-driven replacement of the storage asset, unlike a cycle-limited electrochemical system which typically carries at least one replacement event in a twenty-year hold. Pumps, valves, controls, and insulation are serviceable components with finite lives and should be modeled as maintenance, so this is not a claim that the system is maintenance-free.
Twelve months of interval data from your utility, your actual tariff sheet, a firm installed cost quote, your mechanical engineer's confirmation of any equipment downsizing the storage enables, and your tax professional's read on credit and depreciation position. A monthly bill summary is not sufficient, and any estimate produced without interval data is a guess.
No. Returns are driven by the load you can actually reach and the tariff you are arbitraging, so capacity beyond what your peak requires adds cost without adding savings. Cost per stored kilowatt-hour does improve with module size, which is a reason to consolidate needed capacity into fewer larger modules rather than a reason to buy more capacity than the load justifies.
Payback on commercial thermal energy storage is not a property of the technology. It is a property of your tariff, your load, your net cost after the tax code, and your mechanical design. Two identical tanks in two buildings a mile apart can produce very different returns, and any figure quoted before those four things are known is decoration.
Two structural points are worth carrying into a capital conversation. First, the avoided equipment cost belongs in the model and usually is not there, which means most projects look worse on paper than they are. Second, the absence of a replacement reserve changes the twenty-year picture in a way that simple payback cannot show. Model both, and use a metric that accounts for the full analysis period rather than only the date you break even.
The fastest way to turn a screening estimate into something a capital committee will accept is a short engineering conversation with your interval data and a firm quote in hand.
Tell our team about your building, operating goals, and energy needs.