
A demand charge bills you for the size of the pipe, not the water that flows through it. You can cut total consumption by a fifth and watch this line on the bill refuse to move, because it is not measuring how much electricity you used. It is measuring the single worst fifteen minutes you had.
A peak demand charge is a fee based on the highest average rate of electricity draw, measured in kilowatts, during any interval—usually fifteen minutes—in a billing period. It is billed separately from the energy charge, which covers kilowatt-hours consumed.
Because the utility must build and maintain capacity to serve your maximum draw whenever it happens, the charge recovers that capacity cost. A single fifteen-minute spike can set the charge for an entire month, and under a ratchet clause it can set a floor for the following twelve.
Thermal energy storage reduces demand charges by supplying heating, cooling, or hot water from stored energy instead of running the plant—but only when that plant’s electrical draw actually coincides with the facility’s billed peak.
Key Takeaways
A commercial electricity bill generally has a fixed or customer charge, an energy charge based on kilowatt-hours consumed, and a demand charge based on kilowatts drawn.
This article focuses on the mechanics of demand charges: what they are, how interval meters calculate them, how tariff structures can add multiple demand lines, and how ratchets carry a peak into future billing periods. The strategy comparison between demand-limiting, load-leveling, and storage configurations is covered in Peak Shaving vs Load Shifting.
In this article
What is a peak demand charge?
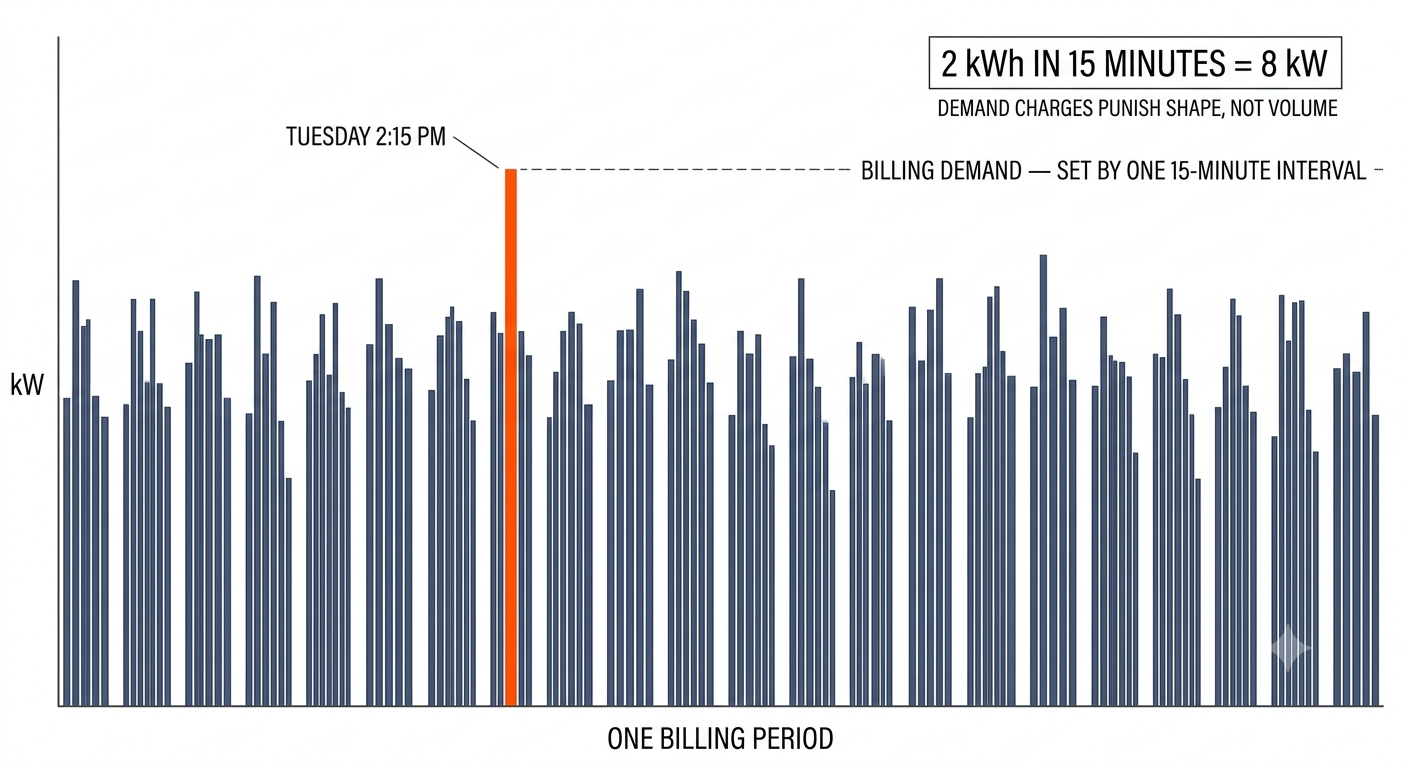
The logic behind the demand charge is capacity. As the DOE national laboratory survey of U.S. demand charges explains, demand charges exist so utilities can recover the cost of providing enough generation and distribution capacity to serve their customers, allocating more of that cost to the customers who drive the need for it. The utility has to keep wires, transformers, and generation available for your maximum draw whether that draw lasts eight hours or fifteen minutes.
That is why efficiency work so often disappoints on this line. Replacing lighting reduces kilowatt-hours all month. It may not touch the fifteen-minute window when the chillers, elevators, and hot water plant all happened to run at once.
How the charge is actually calculated
An interval meter records energy accumulated in each fifteen-minute window and converts it to an average power figure. The arithmetic is simple and worth doing once by hand.
A load accumulating 2 kWh during a fifteen-minute window is recorded as 2 kWh × (60 minutes ÷ 15 minutes) = 8 kW.
A 2 kW load running for the entire hour and an 8 kW load running for exactly one quarter of it consume identical energy—but the second one registers four times the demand. Demand charges punish shape, not volume.
At the end of the billing period, the meter’s highest fifteen-minute average becomes the billing demand. Multiply it by the tariff’s dollar-per-kilowatt rate and that is the charge. A facility whose demand averaged 280 kW all month but touched 450 kW during one simultaneous startup is billed on 450 kW.
Two consequences follow directly. First, simultaneity is the enemy: the classic commercial spike is Monday morning startup, when chillers, air handlers, and hot water recovery all come on together after a weekend setback. Second, duration does not soften it. Fifteen minutes is enough.
The interval conversion
Energy in a 15-minute intervalConversionRecorded average demand
2 kWh2 kWh × (60 ÷ 15)8 kW
The four kinds of demand charge that can appear on one bill
“The demand charge” is usually several charges. SDG&E’s guide to understanding demand provides a clear illustration of non-coincident, on-peak, and generation demand charges billed on the same account, each recovering a different cost and each measured over its own window.
Demand charge types
TypeWhat it measuresWhy it existsWhat storage can do about it
Non-coincident / facility demandYour highest 15-minute draw at any hour, day or night, at your serviceRecovers transmission and distribution capacity sized to your facilityHardest to shave—the peak can occur anytime, so storage must be dispatched on a ceiling, not a schedule
On-peak / time-of-use demandYour highest 15-minute draw within a defined on-peak windowRecovers capacity costs concentrated in the system’s expensive hoursBest case for storage—the window is known in advance and can be scheduled against
Coincident / system peak demandYour draw during the hours the grid peaked, often determined after the factAllocates generation capacity cost by contribution to system peakRequires forecasting or a utility signal; storage can respond but the trigger is external
Ratchet / minimum billing demandA percentage of a prior billing demand, applied as a floorRecovers capacity the utility must hold availableStorage helps only by preventing the original peak—once set, it is locked in
Ratchet clauses: how one afternoon becomes a year
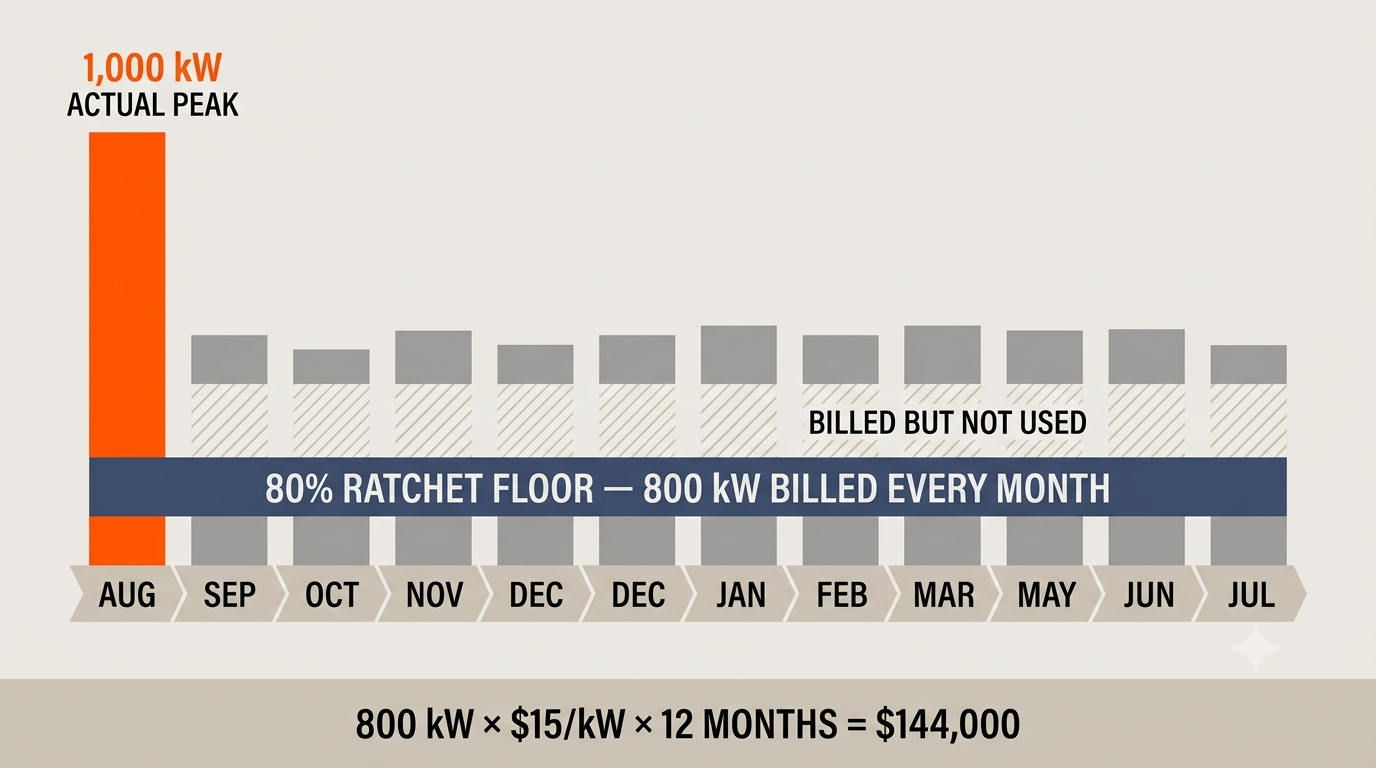
A ratchet clause sets your billable demand at the greater of this month’s actual peak or a stated percentage of the highest peak recorded over some prior window—commonly the preceding eleven or twelve months, at a percentage often in the range of 50% to 90%.
Worked example: a facility hits 1,000 kW during one August afternoon. Its tariff carries an 80% ratchet and a $15/kW demand rate. For the following twelve months, its minimum billable demand is 800 kW—$12,000 per month—regardless of what it actually draws in February. The single event creates roughly $144,000 of exposure that has nothing to do with subsequent behavior.
Two practical implications follow. First, ratchets change the value of reliability. Under a normal monthly demand charge, missing one month’s ceiling costs one month. Under a ratchet, missing it once costs a year, which raises the return on a storage system that holds a ceiling dependably rather than usually.
Second, ratchets make the summer commissioning window critical. A plant that is still being tuned during the hottest week of the year can set a peak that outlives the tuning by eleven months.
To find out whether you have one, look for a bill line labeled billing demand, ratchet demand, or minimum demand that does not change month to month. Then confirm against the rate schedule itself.
Illustrative ratchet calculation
ItemValue
Recorded August peak1,000 kW
Ratchet percentage80%
Minimum billable demand800 kW
Demand rate$15/kW
Monthly minimum demand charge$12,000
Approximate twelve-month exposure$144,000
How big are demand charges, actually?
The number quoted everywhere is that demand charges represent 30% to 70% of a commercial electric bill. It comes from Identifying Potential Markets for Behind-the-Meter Battery Energy Storage: A Survey of U.S. Demand Charges, published by the DOE national laboratory system with Clean Energy Group in August 2017.
Read the endnotes and the picture gets more honest. That report does not derive the 30–70% range from its own analysis—it cites the figure as a commonly referenced range and footnotes it to secondary industry sources. The report is also nine years old. Treat it as a signal that demand charges are material, not as a number to put in your own pro forma.
What the report did measure is more useful, because it came from a survey of more than 10,000 utility tariffs covering roughly 70% of U.S. commercial electric load.
Roughly 5 million commercial customers—more than a quarter of the 18 million total—could subscribe to a tariff with demand charges above $15/kW. About 3 million customers, roughly 15%, could subscribe at $20/kW or higher.
High demand charges are not confined to California and New York. The analysis found significant exposure in Georgia, Michigan, Colorado, Massachusetts, Kentucky, New Mexico, Alabama, Iowa, and Texas.
The variation within states is the part worth internalizing. The figures below are historical and were maximums at the time of the 2017 survey; verify current tariffs before use.
Historical utility maximum demand-charge figures from the 2017 DOE national laboratory survey
StateHighest maximum demand charge foundAverage of utility maximumsMedian of utility maximums
New York$51.25/kW$9.30$4.30
California$47.08/kW$11.45$10.60
Colorado$46.43/kW$21.68$16.65
Massachusetts$41.25/kW$19.14$15.50
Arizona$35.45/kW$18.82$18.50
Georgia$28.70/kW$5.83$3.60
Why efficiency and solar underperform on this line
Both are worth doing. Neither reliably attacks a demand charge.
Efficiency reduces energy, not necessarily shape. A more efficient chiller draws less power at every moment, which does help, but a lighting retrofit or an envelope improvement can cut a large share of annual kilowatt-hours while leaving the coincident startup spike intact.
Solar is intermittent exactly when you need certainty. The same DOE laboratory report is blunt about this: because demand charges are typically assessed on the maximum demand in a month, a few clouds at the wrong time can mostly eliminate a month of solar-enabled demand reduction. Storage, it notes, delivers demand reduction more reliably across a billing cycle.
That reliability asymmetry is the argument for storage against a demand charge, and it gets sharper under a ratchet, where one missed interval propagates for a year. How thermal storage compares with batteries and solar for this purpose is covered in Thermal Energy vs Solar Energy vs Lithium-Ion Storage.
What thermal storage does to the demand curve
Thermal storage attacks a demand charge by decoupling when a thermal service is delivered from when the plant that produces it draws power. Hot water, chilled water, or heating capacity comes out of a tank instead of out of a compressor, and the compressor’s kilowatts never appear in the billed interval.
The share of the load that is thermal is what makes this worth doing. The EIA’s 2018 Commercial Buildings Energy Consumption Survey reports that ventilation, lighting, and cooling together account for 49% of commercial electricity consumption—the largest end uses. Cooling and hot water recovery are dispatchable from storage. Lighting and plug load are not.
Critically, this is a load-shape intervention, not an efficiency one. Total kilowatt-hours stay roughly the same; the plant simply buys them at different hours. That is why demand-charge savings and energy savings have to be modeled separately, and why a blended average electricity rate is useless for this analysis.
The strategy vocabulary—demand-limiting versus load-leveling versus full storage—is worked through in detail in Peak Shaving vs Load Shifting, which is the right next read once the mechanics on this page are clear.
Sizing storage against a kilowatt ceiling: a worked example
Illustrative only. This example omits standing loss, recovery time, part-load performance, and simultaneity with other loads. It demonstrates the structure of the calculation; it does not size a project.
Consider a commercial building with a 900 kW monthly peak, an $18/kW on-peak demand charge, and a 4–9 p.m. on-peak window. Its central heat pump water heating plant draws 40 kW electrical and delivers about 120 kW thermal at a coefficient of performance near 3.0.
1. Energy that must come from storage: to keep the plant off for the full five-hour window, 120 kW thermal × 5 hours = 600 kWh thermal.
2. Translate to modules: at 108 kWh per 700-gallon module, that is six modules, or 648 kWh, with modest margin—before standing-loss and usable-fraction adjustments, which will push it higher.
3. Gross demand reduction: 40 kW × $18/kW = $720 per month, or about $8,640 annually if the reduction is realized every month.
4. Apply the coincidence test. Does the hot water plant actually run during the interval that sets the peak? If the 900 kW peak is set at 2 p.m. by cooling load and the hot water plant runs at 6 a.m., shaving the hot water plant saves nothing on the demand line. Interval data answers this. Nothing else does.
5. Apply the savings cap. Suppose the plant does contribute to the peak, and you remove 40 kW from a 900 kW interval. If the next-highest interval that month sat at 880 kW, your new billing demand is 880 kW, not 860. You are paid $18 × 20 kW, not $18 × 40 kW. Savings equal the gap to the next binding interval, not the kilowatts removed.
The two questions that decide the whole business case are whether the thermal load coincides with the billed peak and what the next-highest interval is. If the thermal load does not coincide, storage may still be worth buying for plant downsizing, resilience, or time-of-use energy arbitrage—but not for the demand line.
A load curve with one sharp spike above a low plateau produces large demand savings. A broad, flat plateau produces very little, no matter how much storage you install.
Any vendor proposing demand-charge savings without interval data is producing a projection, not an estimate. Ask for both questions to be answered from your meter.
Once those answers are in hand, payback structure is worked through in the thermal energy storage ROI calculator, and volume sizing in the thermal storage tank sizing calculator.
Illustrative worked-example inputs and calculations
ItemValue
Facility monthly peak900 kW
On-peak demand charge$18/kW
On-peak window4–9 p.m.
Heat pump water heating electrical draw40 kW
Thermal output120 kW thermal
Coefficient of performanceApproximately 3.0
Storage energy for five-hour plant shutdown600 kWh thermal
700-gallon modules at 108 kWh eachSix modules, or 648 kWh, before adjustments
Gross monthly demand value$720
Gross annual demand value if realized every month$8,640
A five-step tariff audit you can run this week
Start with the rate schedule and twelve months of interval data. Everything else in a demand-charge proposal is downstream of those two documents.
Utility-specific examples require verification
SDG&E’s demand-charge structure and California’s 4–9 p.m. peak window are illustrations, not current rate quotes. Utility tariffs change. Re-verify every tariff-specific detail against the current rate schedule on publish day.
What thermal storage cannot fix
Stating this plainly is more useful than another list of benefits.
The honest framing is a division of labor: electrical peaks belong to batteries, thermal peaks belong to thermal storage, and buildings with both usually need both, each sized to its own load.
Cost and incentives
Vessel list pricing for modular thermal storage runs roughly $54–$97 per stored kWh depending on module size.
Modular thermal storage vessel pricing
ModelList price$/kWh storedStorage capacityStanding loss
80 gallon$1,190$9712.0 kWh7–8°F / 24 hr
350 gallon$3,427$6354.6 kWh3.8°F / 24 hr
500 gallon$4,464$5877.0 kWh3.0°F / 24 hr
700 gallon$5,798$54108.0 kWh2.4°F / 24 hr
Where the savings actually come from
A demand-charge project succeeds when three things are true at once: the tariff contains a meaningful dollar-per-kilowatt charge, a substantial share of the peak-setting interval is thermal, and the load curve has a spike rather than a plateau.
Miss any one and the economics change character entirely. The equipment may still be worth buying, but for different reasons that should be modeled honestly.
Buildings where all three conditions tend to hold include hotels and multifamily properties with sharp hot water recovery peaks, food service and laundries with schedule-driven high-temperature loads, healthcare and senior housing with simultaneous morning demand, and facilities whose cooling plant sets the peak in a territory with an on-peak demand charge.
Examples of how these conditions have resolved on built projects are in the case studies, and the broader operating context is covered in How Commercial Hot Water Thermal Storage Improves System Performance.
Frequently Asked Questions
What is a peak demand charge?
A peak demand charge is a fee based on the highest average rate of electricity draw, measured in kilowatts, during any metering interval in a billing period. It is billed separately from the energy charge, which covers kilowatt-hours consumed. Demand charges exist so utilities can recover the cost of building and maintaining enough generation and distribution capacity to serve each customer’s maximum draw, whenever that draw occurs.
How are demand charges calculated?
An interval meter records the energy accumulated in each interval, usually fifteen minutes, and converts it to an average power figure. Two kilowatt-hours in a fifteen-minute window is recorded as eight kilowatts. The single highest interval in the billing period becomes the billing demand, which is multiplied by the tariff’s dollar-per-kilowatt rate. Duration does not matter: fifteen minutes at a high draw costs the same as an entire month at that draw.
What is a demand ratchet?
A ratchet clause sets your billable demand at the greater of the current month’s actual peak or a stated percentage of the highest peak recorded over a prior window, commonly the preceding eleven or twelve months. Percentages often fall between 50% and 90%. A single high-demand event can therefore establish a cost floor that persists for a year regardless of subsequent consumption.
What percentage of a commercial electric bill is demand charges?
The frequently quoted range is 30 to 70 percent, which originates in a 2017 U.S. Department of Energy national laboratory publication. That report attributes the range to commonly referenced secondary sources rather than deriving it from its own analysis, and it is now nine years old. The reliable answer comes from your own bill: locate the demand line, divide by the total, and repeat across twelve months.
How does thermal storage reduce demand charges?
Thermal storage separates when a thermal service is delivered from when the plant producing it draws power. Hot water, chilled water, or heating capacity comes from a charged tank while the compressor stays off, so those kilowatts never appear in the billed interval. This is a load-shape intervention rather than an efficiency measure: total kilowatt-hours stay roughly the same and are purchased at different hours.
Will thermal storage definitely lower my demand charge?
Only if the thermal plant’s electrical draw actually coincides with the interval that sets your billed peak, and only up to the next-highest interval in that month. If your peak is set by cooling at two in the afternoon and your hot water plant runs at six in the morning, shaving the hot water plant does not touch the demand line. Twelve months of interval data is the only way to answer this.
Why didn’t my efficiency upgrade reduce my demand charge?
Efficiency measures reduce kilowatt-hours consumed, which lowers the energy charge, but they do not necessarily change the shape of the load curve. If the peak-setting interval is caused by several systems starting simultaneously, reducing the continuous draw of any one of them may leave that coincident spike largely intact.
Is a battery or thermal storage better for demand charges?
It depends on what causes the peak. Electrical loads such as elevators, EV charging, refrigeration, and process equipment can only be served by a battery. Peaks driven by cooling, heating, or hot water recovery can be served by thermal storage, typically at a lower cost per stored kilowatt-hour. Buildings with both kinds of peak often need both, each sized to its own load.
Conclusion
Demand charges are the line item most commercial buildings understand least and pay most reliably. They measure shape rather than volume, they can be set by a single quarter-hour, and under a ratchet they can outlive the event that caused them by a year.
Thermal storage is a legitimate and often underpriced answer—but only against thermal peaks, only when those peaks coincide with the billed interval, and only up to the next-highest interval in the month. Those three conditions are checkable before anyone quotes equipment, and they should be.
Start with the rate schedule and twelve months of interval data. Everything else in a demand-charge proposal is downstream of those two documents.
About the Author
Garth Schultz
Garth Schultz is President of Thermal Energy HQ, where he leads development of modular thermal energy storage systems and integrated thermal energy solutions.